
forbidden word: racial inequality
racial
racial, adj
-
of or relating to the social construct of race.
racial diversity;
racial stereotypes. -
(no longer in technical use) of, relating to, or characteristic of one race or the races of humankind.
Other Word Forms
- racially adverb
- antiracial adjective
- nonracial adjective
Word History and Origins
Origin of racial1
First recorded in 1860–65; race 2 + -ial
from — Dictionary.com | Meanings & Definitions of English Words. (2025d). In Dictionary.com.
~ ~
identity
inequality
noun
-
the condition of being unequal; lack of equality; disparity.
inequality of size. -
a. social or economic disparity: widening income inequality in America.
inequality between rich and poor people;
widening income inequality in America.b. unequal opportunity or treatment resulting from this disparity.
inequality in healthcare and education. -
disparity or relative inadequacy in natural endowments.
a startling inequality of intellect, talents, and physical stamina. -
unevenness, as of surface.
-
an instance of unevenness.
-
variableness, as of climate.
-
Astronomy.
-
any component part of the departure from uniformity in astronomical phenomena, especially in orbital motion.
-
the amount of such a departure.
-
-
Mathematics. a statement that two quantities are unequal, indicated by the symbol ≠; alternatively, by the symbol <, signifying that the quantity preceding the symbol is less than that following, or by the symbol >, signifying that the quantity preceding the symbol is greater than that following.
Word History and Origins
Origin of inequality¹
First recorded in 1375–1425; late Middle English inequalite “unevenness, disparity,” from Old French inequalite, from Latin inaequālitāt- stem of inaequālitās “irregularity, inequity, inconsistency”; in- ³, equality
~ ~
racial inequality
I have posted the entirety of articles from Wikipedia and U.S. Department of Treasury below.
Racial inequality in the United States – wikipedia
In the United States, racial inequality refers to the social inequality and advantages and disparities that affect different races. These can also be seen as a result of historic oppression, inequality of inheritance, or racism and prejudice, de jure and de facto segregation,[1] specifically against racial minority groups.[2]
A 2021 survey of 1,422 members of the American Economic Association found that 78 percent of professional economists generally agreed with the statement: “Differences in economic outcomes between whites and blacks in the US are in large part due to the persistence of discriminatory norms and institutions.”[3]
There are vast differences in wealth across racial groups in the United States. The wealth gap between Caucasian and African American families substantially increased from $85,000 in 1984 to $236,500 in 2009. According to survey data presented by the ACLU, the wealth gap as of 2018 stands at $33,000. While the average income for a white family of three is roughly $84,600, a Black family of the same size would only earn $51,600.[4] Many causes relate to racial inequality such as: Years of home ownership, household income, unemployment, education, lack of upward social mobility, and inheritance/generational wealth.[5] In 1863, two years prior to emancipation, Black people owned 0.5 percent of the national wealth, while in 2019 it is just over 1.5 percent.[6] Though some Black journalists, such as Jesse Lee Peterson, disagree, pointing to systemic failings within the Black community as being the real causes for the wealth gap.[7]
Under slavery, African Americans were treated as property. After the American Civil War, Black sharecroppers became trapped in debt. African Americans were rarely able to homestead. The Freedman’s Savings Bank failed, losing many Black assets.[8][9]
Exclusions from Social Security disproportionately affected African Americans. Savings were spent for retirement instead of handed down as inheritance. African Americans are less likely to receive an inheritance and more likely to aid poor family members.[10]
The Federal Housing Administration and Veteran’s Administration shut out African Americans by giving loans to suburbs instead of central cities. Housing segregation caused unequal living standards and poverty. Public education greatly relies on local property taxes, with racial inequality between White affluent suburbs and poor minorities in inner-cities.[11]
Criminal records lead to employment and income struggles. Inability to make bail and quality counsel are factors. Racial segregation and racial profiling lead to differences between races.[12] After World War I, white families found themselves displaced in an economy which made housing a luxury good. After the Great Depression, this disparity was exacerbated even more. Because of this, New Deal programs were created and managed by the Public Works Administration (PWA) in 1933 to aid in neighborhood composition. The way of doing this would be seen in segregated housing, even in already integrated communities. In 1937, the PWA was replaced with the U.S. Housing Authority (USHA). While they adopted many of the PWA’s policies, they focused particularly not on the location of public housing but on the racialization components. At this time, public housing was only made available to white individuals. Therefore, African Americans and all BIPOC individuals were forced into racial silos. The housing that was available to all minority groups was scarce and, therefore, significantly more expensive. “Rent to buy” sellers would allow African Americans the opportunity to build wealth through homeownership, but the home’s equity would not be attainable until the home was fully paid off. High-density areas of BIPOC folks became the standard since most housing was used for multi-family homes. Oftentimes, these homes would simply be built-in extensions of single-family homes because a lack of housing did not allow for African Americans to fit in anywhere else in the economic sector. One low interest rate programs and subsidized housing for the white suburbanization of America became standardized, BIPOC folks would be allowed to utilize public housing. However, this led to a new stigma in which public housing became “The projects.” Those who lived in public housing were now seen as criminals, dirty, lazy, and the opposite of disciplined hard working individuals. Even today, this stigma stands in all branches of welfare an individual belonging to a minority community may utilize.[13]
Definitions
In social science, racial inequality is typically defined as “imbalances in the distribution of power, economic resources, and opportunities.”[5] Racial inequalities have manifested in American society in ways ranging from racial disparities in wealth, poverty rates, bankruptcy, housing patterns, educational opportunities, unemployment rates, and incarceration rates.[5][14]: 231 [15][16][17][18][19] Current racial inequalities in the U.S. have their roots in over 300 years of cultural, economic, physical, legal, and political discrimination based on race.[20] Leland T. Saito, Associate Professor of Sociology and American Studies & Ethnicity at the University of Southern California, writes, “Political rights have been circumscribed by race, class and gender since the founding of the United States, when the right to vote was restricted to White men of property. Throughout the history of the United States race has been used by Whites for legitimizing and creating difference and social, economic and political exclusion.”[21] Additionally, the United States Department of Treasury describes the definition of wealth as, “Wealth is defined as the total financial value of what an individual or household owns (assets) minus all debts (liabilities)” [22]
History
Before the 1808 abolition of the transatlantic slave trade, Africans would be captured and brought into the United States as enslaved people, depriving them of all property, and in some cases family. In order to prevent rebellion or escape, the slave codes in some states banned education of slaves, especially teaching a slave to read or write. Redistribution of land from white owners to the people formerly forced to work it was attempted under the forty acres and a mule policy of Union General William Tecumseh Sherman. This was reversed by President Andrew Johnson, a Southern Democrat who also opposed political rights for African Americans and protections against white violence in the South.[23] Slavery continued in the border states until ratification of the Thirteenth Amendment to the United States Constitution in December 1865.[24]
The Freedmen’s Bureau was created as part of the War Department by President Abraham Lincoln to provide shelter and supplies to freed slaves. It was supported by the Republican Congress over the veto of Andrew Johnson, but was soon de-funded and abandoned by a Democrat-controlled Congress in 1872.[25]
While free African Americans owned around $50 million by 1860, farm tenancy and sharecropping replaced slavery after the American Civil War because newly freed African American farmers did not own land or supplies and had to depend on the White Americans who rented the land and supplies out to them. At the same time, southern Blacks were trapped in debt and denied banking services while White citizens were given low-interest loans to set up farms in the Midwest and Western United States. White homesteaders were able to go West and obtain unclaimed land through government grants, while the land grants and rights of African Americans were rarely enforced.[26]
After the Civil War the Freedman’s Bank helped to foster wealth accumulation for African Americans. However, it failed in 1874, partially because of suspicious high-risk loans to White banks and the Panic of 1873. This lowered the support African Americans had to open businesses and acquire wealth. In addition, after the bank failed, taking the assets of many African Americans with it, many African Americans did not trust banks. There was also the threat of lynching to any African American who achieved success.[26]
In addition, when Social Security was first created during the Great Depression, it exempted agricultural and domestic workers, which disproportionately affected African Americans and Hispanics. Consequently, the savings of retired or disabled African Americans were spent during old age instead of being handed down and households had to support poor elderly family members. The Homeowner’s Loan Corporation, which helped homeowners during the Great Depression gave African American neighborhoods the lowest rating, ensuring that they defaulted at greater rates than White Americans. The Federal Housing Authority (FHA) and Veteran’s Administration (VA) shut out African Americans by giving loans to suburbs instead of central cities after they were first founded.[26]
The growing Blaxit movement is now seeing large numbers of African Americans moving to Africa to benefit from the new growth opportunities.[27]
Racial wealth gap
A study by the Brandeis University Institute on Assets and Social Policy which followed the same sets of families for 25 years found that there are vast differences in wealth across racial groups in the United States. The wealth gap between Caucasian and African-American families studied nearly tripled, from $85,000 in 1984 to $236,500 in 2009. The study concluded that factors contributing to the inequality included years of home ownership (27%), household income (20%), education (5%), and familial financial support and/or inheritance (5%).[28] In an analysis of the American Opportunity Accounts Act, a bill to introduce Baby Bonds, Morningstar reported that by 2019 white families had more than seven times the wealth of the average Black family, according to the Survey of Consumer Finances.[29]
 Median household income along ethnic lines in the United States
Wealth can be defined as “the total value of things families own minus their debts.” In contrast, income can be defined as, “earnings from work, interest and dividends, pensions, and transfer payments.”[28] Wealth is an important factor in determining the quality of both individual and family life chances because it can be used as a tool to secure a desired quality of life or class status and enables individuals who possess it to pass their class status to their children. Family inheritance, which is passed down from generation to generation, helps with wealth accumulation.[30] Wealth can also serve as a safety net against fluctuations in income and poverty.[31]
There is a large gap between the wealth of minority households and white households within the United States. The Pew Research Center’s analysis of 2009 government data says the median wealth of white households is 20 times that of Black households and 18 times that of Hispanic households.[32] In 2009 the typical Black household had $5,677 in wealth, the typical Hispanic had $6,325, and the typical white household had $113,149.[32] Furthermore, 35% of African American and 31% of Hispanic households had zero or negative net worth in 2009 compared to 15% of white households.[32] While in 2005 median Asian household wealth was greater than white households at $168,103, by 2009 that changed when their net worth fell 54% to $78,066, partially due to the arrival of new Asian immigrants since 2004; not including newly arrived immigrants, Asian net wealth only dropped 31%.[32] According to the Federal Reserve Survey of Consumer Finances, of the 14 million Black households, only 5% have more than $350,000 in net worth while nearly 30% of white families have more than this amount. Less than 1% of Black families have over a million in net assets. while nearly 10% of white households, totaling over 8 million families have more than 1.3 million in net worth. According to the Federal Reserve of Cleveland the wealth gap between white and Black Americans has remained roughly the same since 1962, when the average white family had seven times the wealth of the average Black family.[33]
Lusardi states that African Americans and Hispanics are more likely to face means-tested programs that discourage asset possession due to higher poverty rates.[34] One-fourth of African Americans and Hispanics approach retirement with less than $1,000 net worth (without considering pensions and Social Security). Lower financial literacy is correlated with poor savings and adjustment behavior. Education is a strong predictor for wealth.[34] One-fourth of African Americans and Hispanics who have less than a high school education have no wealth, but even with increased education, large differences in wealth remain.[34]
Conley believes that the cause of Black-White wealth inequality may be related to economic circumstances and poverty because the economic disadvantages of African Americans can be effective in harming efforts to accumulate wealth.[26] However, there is a five times greater chance of downward mobility from the top quartile to the bottom quartile for African Americans than there is for white Americans; correspondingly, African Americans rise to the top quartile from the bottom quartile at half the rate of white Americans. Bowles and Gintis conclude from this information that successful African Americans do not transfer the factors for their success as effectively as white Americans do.[35] Other factors to consider in the recent widening of the minority wealth gap are the subprime mortgage crisis and 2008 financial crisis. The Pew Research Center found that plummeting house values were the main cause of the wealth change from 2005 to 2009. Hispanics were hit the hardest by the housing market meltdown, possibly because a disproportionate share of Hispanics live in California, Florida, Nevada, and Arizona, which are among the states with the steepest declines in housing values.[32] From 2005 to 2009 Hispanic homeowners’ home equity declined by Half, from $99,983 to $49,145, with the homeownership rate decreasing by 4% to 47%.[32] A 2015 Measure of America study commissioned by the ACLU on the long-term consequences of discriminatory lending practices found that the 2008 financial crisis will likely widen the Black-white wealth gap for the next generation.[36]
The racial wealth gap essentially is composed of a private wealth management industry maintaining Whiteness to act as a barrier to prevent those of color from equal financial development.[37] This disparity has been debated, but never disputed due to its “very real” implications it has on African Americans. Data has shown that “among racial and ethnic groups, African Americans had the highest poverty rate at 27.4%”.[38]
Inheritance and parental financial assistance
Bowman states that “in the United States, the most significant aspect of multigenerational wealth distribution comes in the forms of gifts and inheritances.” However, the multigenerational absence of wealth and asset attainment for African Americans makes it almost impossible for them to make significant contributions of wealth to the next generation.[39] Data shows that financial inheritances could account for 10 to 20 percent of the difference between African American and White American household wealth.[40]
Using the Health and Retirement Study (HRS) of 1992, Avery and Rendall estimated that only around one-tenth of African Americans reported receiving inheritances or substantial inter vivo transfers ($5,000 or more) compared to one-third of white Americans. In addition, the 1989 Survey of Consumer Finances (SCF) reported that the mean and median values of those money transfers were significantly higher for white American households: the mean was $148,578 households compared to $85,598 for African American households and the median was $58,839 to $42,478. The large differences in wealth in the parent-generations were a dominant factor in prediction the differences between African American and white American prospective inheritances.[41] Avery and Rendall used 1989 SCF data to discover that the mean value in 2002 of white Americans’ inheritances was 5.46 times that of African Americans’, compared to 3.65 that of current wealth. White Americans received a mean of $28,177 that accounted for 20.7% of their mean wealth while African Americans received a mean of $5,165 that accounted for 13.9% of their mean current wealth. Non-inherited wealth was more equally distributed than inherited wealth.[41]
Avery and Rendall found that family attributes favored white Americans when it came to factor influencing the amount of inheritances. African Americans were 7.3% less likely to have live parents, 24.5% more likely to have three or more siblings, and 30.6% less likely to be married or cohabiting (meaning two people could gain inheritances to contribute to the household)[41] Keister discovered that large family size harms wealth accumulation. These negative effects are worse for the poor and African Americans and Hispanics are more likely to be poor and have large families. More children also decrease the amount of gifts parents can give and the inheritance they leave behind for the children.[42]
Angel’s research into inheritance showed that older Mexican American parents may give less financial assistance to their children than non-Hispanic White Americans because of their relatively high fertility rate so children have to compete for the available money. Some studies indicate that elderly Hispanic parents of all backgrounds live with their adult children due to poverty and would choose to do otherwise, even if they had the resources to do so. African American and Latino families are less likely to financially aid adult children than non-Hispanic white families.[40]
Income effects
The racial wealth gap is visible in terms of dollar for dollar wage and wealth comparisons. For example, middle-class Blacks earn seventy cents for every dollar earned by similar middle-class whites.[30] Race can be seen as the “strongest predictor” of one’s wealth.[43]
Krivo and Kaufman found that information supporting the fact that increases in income does not affect wealth as much for minorities as it does for white Americans. For example, a $10,000 increase in income for white Americans increases their home equity $17,770 while the same increase only increase the home equities for Asians by $9,500, Hispanics by $15,150, and African Americans by $15,900.[44]
Pandemic Income Effects
According to a report from the New York Federal Reserve Bank, presented by AP News, “The real net worth of white individuals outgrew that of Black and Hispanic individuals by 30 percentage points and 9 percentage points respectively, from the first quarter of 2019 through the second quarter of 2023.” Remarkable government aid was seen through this period which aided all American citizens equally. Record rates of low unemployment were seen even in BIPOC communities. Stimulus checks proved extremely helpful and as a viable solution in closing the gap during the COVID-19 induced recession. However, financial asset prices quickly increased and widened the gap between white individuals and marginalized groups once again. Additionally, “During the pandemic, the real value of Black-held financial assets dropped in 2022 to below its 2019 level and continued to decline steadily, while the real value of Hispanic-held financial assets dipped below its 2019 level in 2022 and stagnated.” Job loss in Black-owned business sectors continued to enlarge the gap as their economic livelihood would not survive the pandemic.[45]
Financial decisions
Investments
Conley states that differences between African American and white American wealth begin because people with higher asset levels can take advantage of riskier investment instruments with higher rates of returns. Unstable income flows may lead to “cashing in” of assets or accumulation of debt over time, even if the time-averaged streams of income and savings are the same. African Americans may be less likely to invest in the stock market because they have a smaller parental head-start and safety net.[26]
Chong, Phillips and Phillips state that African Americans, Hispanics, and Asians invest less heavily in stocks than white Americans.[46] Hispanics and in some ways African Americans accumulate wealth slower than white Americans because of preference for near-term saving, favoring liquidity and low investment risk at the expense of higher yielding assets. These preferences may be due to low financial literacy leading to a lack of demand for investment services.[46] According to Lusardi, even though the stock market increased in value in the 1990s, only 6-7% of African Americans and Hispanics held stocks, so they did not benefit as much from the value increase.[34]
Use of financial services
The Federal Deposit Insurance Corporation in 2009 found that 7.7% of United States households are unbanked. Minorities are more likely than white Americans to not have a banking account. 3.5% of Asians, 3.3% of white Americans, 21.7% of African Americans and 19.3% of Hispanics and 15.6% of remaining racial/ethnic categories do not have banking accounts.[46]
Lusardi’s research revealed that education increases one’s chances of having a banking account. A full high school education increases the chance of having a checking account by 15% compared to only an elementary education; having a parent with a high school education rather than only an elementary education increases one’s chances of having a checking account by 2.8%. This difference in education level may explain the large proportion of “unbanked” Hispanics. The 2002 National Longitudinal Survey found that while only 3% of white Americans and 4% of African Americans had only an elementary education, close to 20% of Hispanics did and 43% of Hispanics had less than a high school education[34] Ibarra and Rodriguez believe that another factor that influences the Hispanic use of banking accounts is credit. Latinos are also more likely than white Americans or African Americans to have no or a thin credit history: 22% of Latinos have no credit score in comparison to 4% of white Americans and 3% of African Americans.[47]
Not taking other variables into account, Chong, Phillips, and Phillips survey of zip codes found that minority neighborhoods don’t have the same access to financial planning services as white neighborhoods. There is also client segregation by investable assets. More than 80% of financial advisors prefer that clients have at least $100,000 in investable assets and more than 50% have a minimum asset requirement of $500,000 or above. Because of this, financial planning is possibly beyond the reach of those with low income, which comprises a large portion of African-Americans and Hispanics.[46] Fear of discrimination is another possible factor. Minorities may be distrustful of banks and lack of trust was commonly reported as why minorities, people with low education, and the poor chose not to have banking accounts.[34] Evidence suggests that women of color are disproportionately likely to plan on using informal borrowing as their sole strategy for coping with an emergency expense, potentially due to a lack of access to formal banking services.[48]
Aid to family members
Though African Americans who attend college get a similar boost in income to white peers, they tend not to have a similar increase in wealth, largely because they spend more money helping poor family members, including older relatives who in white families are instead more likely to help younger kin.[49]
Health care
Black Americans face consistently worse health outcomes than white, Asian, and Hispanic Americans. Black women are 2½ times more likely to die of maternal causes than white women and this rate increases to 3 times when compared to Hispanic Americans.[50] The infant mortality rate for Black Americans is 11 per 1,000 births which is higher than the US average of 5.7.[51][52] There exists gaps in life expectancy between races with Black and Native Americans having the lowest life expectancies.[53] The gap between Black and white Americans on average is four years; however, there is great variation between states and even on smaller levels. For example in Wisconsin this gap is six years, and in Washington, D.C., this gap is more than ten years.[53][54][55] African American women have the highest rate of obesity or being overweight in the US and non-Hispanic Blacks are 1.3 times more likely to be obese than non-Hispanic Whites.[56]
Poverty
There are large differences in poverty rates across racial groups. In 2009, the poverty rate across the nation was 9.9%. This data illustrates that Hispanics and Blacks experience disproportionately high percentages of poverty in comparison to non-Hispanics whites and Asians. In discussing poverty, it is important to distinguish between episodic poverty and chronic poverty.[57][58]
Episodic poverty
The U.S. Census Bureau defines episodic poverty as living in poverty for less than 36 consecutive months.[59] From the period between 2004 and 2006 the episodic poverty rate was 22.6% for non-Hispanic whites, 44.5% for Blacks, and 45.8% for Hispanics.[59] Blacks and Hispanics experience rates of episodic poverty that are nearly double the rates of non-Hispanic whites.[60]
Chronic poverty
The U.S. Census Bureau defines chronic poverty as living in poverty for 36 or more consecutive months.[59] From the period between 2004 and 2006 the chronic poverty rate was 1.4% for non-Hispanic whites, 4.5% for Hispanics, and 8.4% for Blacks.[59] Hispanics and Blacks experience much higher rates of chronic poverty when compared to non-Hispanic whites.
Length of poverty spell
The U.S. Census Bureau defines length of poverty spell as the number of months spent in poverty. The median length of poverty spells was 4 months for non-Hispanic whites, 5.9 months for Blacks, and 6.2 months for Hispanics.[59] The length of time spent in poverty varies by race. Non-Hispanic whites experience the shortest length of poverty spells when compared to Blacks and Hispanics.
Housing
Housing segregation
Housing segregation in the United States is the practice of denying African American or other minority groups equal access to housing through the process of misinformation, denial of realty and financing services, and racial steering.[61][62][63] Housing policy in the United States has influenced housing segregation trends throughout history.[64][65] Key legislation include the National Housing Act of 1934, the GI Bill, and the Fair Housing Act.[64][66][67] Factors such as socioeconomic status, spatial assimilation, and immigration contribute to perpetuating housing segregation.[65][67][68][69] The effects of housing segregation include relocation, unequal living standards, and poverty.[66][70][71][72][73][74][75] However, there have been initiatives to combat housing segregation, such as the Section 8 housing program.[69][76]
Racial residential segregation doubled from 1880 to 1940.[77] Southern urban areas were the most segregated.[77] Segregation was highly correlated with lynchings of African-Americans.[78] Segregation adversely affected both black and white homeownership rates,[79] as well as caused higher crime rates.[80] Areas with housing segregation had worse health outcomes for both whites and Blacks.[81] Residential segregation accounts for a substantial share of the Black-white gap in birth weight.[82] Segregation reduced upward economic mobility.[83]
White communities are more likely to have strict land use regulations (and whites are more likely to support those regulations).[84][85] Strict land use regulations are an important driver of housing segregation along racial lines in the United States.[84]
Eviction
Black tenants face significantly higher filing and eviction rates than their white counterparts.[86] Looking at neighborhood racial composition in Milwaukee, sociologist Matthew Desmond found that majority-black neighborhoods had an average annual eviction rate of 7.4%, compared to 1.4% in majority-white neighborhoods.[87] In this study, Desmond also emphasizes the dual disadvantage black women face in housing—black women face the highest eviction rates of any demographic group.[87] In an interview with The Atlantic, Desmond reported that approximately one in five black women will experience eviction, compared to one in fifteen white women.[88] Eviction rates are also linked to the racial concentration of neighborhoods. The RVA Eviction Lab, in Richmond, Virginia, estimates that as the proportion of a neighborhood’s black population increases by 10%, eviction rates would increase by 1.2%.[89]
Hispanic renters also face higher filing and eviction rates than their white counterparts. In a study published in the Harvard Civil Rights–Civil Liberties Law Review, researchers investigated the relationship between Hispanic origin and eviction in Milwaukee. These researchers saw a strong correlation between Hispanic tenants’ risk of eviction and neighborhood racial composition.[90] In Milwaukee neighborhoods that were two-thirds white, approximately 80% of landlords were white. In these same neighborhoods, the average eviction rate was 25%, yet the eviction rate for Hispanics was upwards of 35%.[90] The study also found that Hispanic renters were significantly more likely to be evicted by white landlords than non-white landlords.[90] According to Greenberg et al, these findings suggest that discrimination contributes to racial disparities in Milwaukee eviction rates.[90]
Employment
 Wealth over the decades for U.S. citizens

In 2016, the unemployment rate was 3.8% for Asians, 4.6% for non-Hispanic whites, 6.1% for Hispanics, and 9.0% for Blacks, all over the age of 16.[18] In terms of unemployment, it can be seen that there are two-tiers: relatively low unemployment for Asians and whites, relatively high unemployment for Hispanics and Blacks. According to the New York Times, “There are several explanations for the racial disparity. White workers might have had more wealth or savings to weather unemployment than their Black counterparts did, but at a cost to their upward mobility. They might also have been less willing to find another job.”[91]
Potential explanations
Several theories have been offered to explain the large racial gap in unemployment rates:
Segregation and job decentralization
This theory argues that the effects of racial segregation pushed Blacks and Hispanics into the central city during a time period in which jobs and opportunities moved to the suburbs. This led to geographic separation between minorities and job opportunities which was compounded by struggles to commute to jobs in the suburbs due to lack of means of transportation. This ultimately led to high unemployment rates among minorities.[92]
White gains
This theory argues that the reason minority disadvantage exists is because the majority group is able to benefit from it. For example, in terms of the labor force, each job not taken by a Black person could be job that gets occupied by a white person. This theory is based on the view that the white population has the most to gain from the discrimination of minority groups. In areas where there are large minority groups, this view predicts high levels of discrimination to occur for the reason that white populations stand to gain the most in those situations.[92]
Job skill differentials
This theory argues that the unemployment disparity can be attributed to lower rates of academic success among minority groups (especially Black Americans) leading to a lack of skills necessary for entering the modern work force.[92] The author remains unclear why Black Americans have low academic success.
Other explanations
It is politically incorrect to assume that racial inequality is caused by differences in skills or preferences. The lack of open discussion leads to ethnic groups being treated equally. This means that diverse groups receive the same offers which have different advantages for different groups, which further increases inequality.
Employment discrimination
As of February 2025, the Citing Slavery Project of Michigan State University found more than 7,000 direct case law citations of legal disputes over slaves as property (including Prigg v. Pennsylvania in 274 cases) that remained widely cited by lawyers and judges in the United States as precedents, and have been identified by employment discrimination lawyers as being the reason why courts in the United States rarely find civil rights violations in employment and other contexts.[93]
Education
In the United States, funding for public education relies greatly on local property taxes. Local property tax revenues may vary between different neighborhoods and school districts. This variance of property tax revenues amongst neighborhoods and school districts leads to inequality in education. This inequality manifests in the form of available school financial resources which provide educational opportunities, facilities, and programs to students.[17] For every student enrolled, the average nonwhite school district receives $2,226 less than a white school district.[95]
Returning to the concept of residential segregation, it is known that affluence and poverty have become both highly segregated and concentrated in relation to race and location.[96] Residential segregation and poverty concentration is most markedly seen in the comparison between urban and suburban populations in which suburbs consist of majority white populations and inner-cities consist of majority minority populations.[96] According to Barnhouse-Walters (2001), the concentration of poor minority populations in inner-cities and the concentration of affluent white populations in the suburbs, “is the main mechanism by which racial inequality in educational resources is reproduced.” According to Human Capital Theory, BIPOC individuals cannot experience upward social mobility due to their lack of investment in education. This stems from the belief that the United States works as a meritocratic society. However, when wealth is tied to education, accessibility to upward mobility is lost.[97] It is extremely difficult to empirically measure human capital as it is a hypothetical predictor of an individual’s predicted labor earnings. As a result, an intersectional oversight of education and crime can be stronger indicators of tangible obstacles which obstruct building wealth.[98]
Crime rates and incarceration
In 2008, the prison population under federal and state correctional jurisdiction was over 1,610,446 prisoners. Of these prisoners, 20% were Hispanic (compared to 16.3% of the U.S. population that is Hispanic), 34% were White (compared to 63.7% of the U.S. population that is White), and 38% were Black (compared to 12.6% of the U.S. population that is Black).[19][99] Additionally, Black males were imprisoned at a rate 6.5 times higher than that of their White male counterparts.[19] According to a 2012 study by the U.S. Census Bureau, “over half the inmates incarcerated in our nation’s jails is either Black or Hispanic.”[100] According to a report by the National Council of La Raza, research obstacles undermine the census of Latinos in prison, and “Latinos in the criminal justice system are seriously undercounted. The true extent of the overrepresentation of Latinos in the system probably is significantly greater than researchers have been able to document.[101]
Consequences of a criminal record
The injustices of a criminal justice system disproportionately impact Black people; maintaining these racial disparities has a high cost for individuals, families, and communities. On an individual level, a criminal conviction may equate to loss of access to employment, housing, and public service opportunities. On the community level, the disproportionate incarceration of people from poorer communities depletes the economic resources of said community and curates cycles of poverty that becomes increasingly harder to get rid of. These communities also face increased criminal justice involvement in their communities, making criminal justice contact a norm in the lives of an immense number of Black Americans.[102]
After being released from prison, the consequences of having a criminal record are immense. Over 40 percent who are released will return to prison within the next few years. Those with criminal records who do not return to prison face significant struggles to find quality employment and income outcomes compared to those who do not have criminal records.[103]
Those racially disparate employment consequences can arise from other forms of carceral contact, too, and they can have spillover effects on local communities. At the county level, for example, jail rather than prison incarceration has been found to significantly diminish local labor markets in areas with relatively high proportions of Black residents.[104]
Potential causes
Poverty
A potential cause of such disproportionately high incarceration rates for Black Americans is that Black Americans are disproportionately poor.[105] Conviction is a crucial part of the process that leads to either guilt or innocence. There are two important factors that play a role in this part of the process: the ability to make bail and the ability to access high-quality legal counsel. Due to the fact that both of these important factors cost money, it is unlikely that poor Black Americans are able to afford them and benefit from them.[105] Sentencing is another crucial part of the process that determines how long individuals will remain incarcerated. Several sociological studies have found that poor offenders receive longer sentences for violent crimes and crimes involving drug use, unemployed offenders are more likely to be incarcerated than their employed counterparts, and then even with similar crimes and criminal records minorities were imprisoned more often than whites.[105]
Racial profiling
Racial profiling is defined as “any police-initiated action that relies on the race, ethnicity, or national origin, rather than the behavior of an individual or information that leads the police to a particular individual who has been identified as being, or having been, engaged in criminal activity.”[106] Another potential cause for the disproportionately high incarceration rates of Blacks and Hispanics is that racial profiling occurs at higher rates for Blacks and Hispanics. Eduardo Bonilla-Silva states that racial profiling can perhaps explain the over representation of Blacks and Hispanics in U.S. prisons.[16] According to Michael L. Birzer, professor of criminal justice at Wichita State University and director of its School of Community Affairs, “racial minorities, particularly African Americans, have had a long and troubled history of disparate treatment by United States Criminal Justice Authorities.”[100] A report by the National Registry of Exonerations found that African Americans were seven times more likely to be falsely convicted compared to White Americans.[107]
Racial segregation
“Racial residential segregation is a fundamental cause of racial disparities in health”.[108] Racial segregation can result in decreased opportunities for minority groups in income, education, etc. While there are laws against racial segregation, study conducted by D. R. Williams and C. Collins focuses primarily on the impacts of racial segregation, which leads to differences between races.[109]
Police brutality
Significant racial discrepancies have been reported in the United States involving police brutality. Police brutality in the United States is defined as “the unwarranted or excessive and often illegal use of force against civilians by U.S. police officers.”[110] It can come in the form of murder, assault, mayhem, or torture, as well as less physical means of violence including general harassment, verbal abuse, and intimidation.[110] it has been argued that the origins of racial inequality by way of police brutality in America date to colonial times when slavery was legal and widespread. Due to fear of slave revolts, White Americans began to organize groups of vigilantes who would use force to keep slaves from rebelling against their owners or escaping.[111]
During the civil rights era, the existence of the racial disparities surrounding police brutality became more discussed. During peaceful protests for civil rights, some police would use tactics such as police dogs or fire hoses to control the protesters. In 1991, video footage was released of cab driver Rodney King being hit over 50 times by multiple police with their batons. The police were later acquitted for their actions which resulted in the 1992 Los Angeles riots. Allegations of police brutality continue to plague American police.[112] An alleged example of police brutality includes Philando Castile, a 32-year-old Black male who was pulled over for a broken taillight. After being told by officer Yanez, to take out his license and insurance, Castile told the officer he had a firearm and that he was reaching into his pocket to get his wallet. Seconds later he was shot and killed by Yanez, who claimed he believed Castile was pulling his gun out.[113] Yanez was charged with manslaughter and acquitted at trial.[114]
Black Americans are 2–3 times more likely to be killed in a police shooting than White Americans and are more likely to be unarmed during those fatal instances.[115][116][117][118] A study done by Joshua Correll at the University of Chicago shows what is called “The police officers dilemma”,[119] by setting up a video game in which police are given scenarios involving both Black and White men holding either a gun or non-threatening objects such as cellphones. The study found that armed Black men were shot more frequently than armed White men and were also shot more quickly. The police would also sometimes mistakenly shoot the unarmed Black targets, while neglecting to shoot the armed White targets.[119] Militarized police units are more often deployed in Black neighborhoods even after adjusting for crime rates.[120]
A 2020 study by Cody Ross et al. concluded that there was evidence of bias in police shootings of unarmed Blacks and that even when using crime as a benchmark “there is strong and statistically reliable evidence of anti-Black racial disparities in the killing of unarmed Americans by police”.[121][122] A study by Harvard economist Roland Fryer found that for officer-involved shootings there were no racial disparities “in either the raw data or when contextual factors are taken into account”.[124] According to data from the Chicago Police Department police used more force against Black people than any other race despite the fact that they were less likely to resist arrest than Whites.[125] Around 20% of the population of Minneapolis is Black but they are subjected to nearly 60% of total police use of force.[126]
Color-blind racism
It is hypothesized by some scholars, such as Michelle Alexander, that in the since the Civil Rights Era, the United States has now switched to a new form of racism known as color-blind racism. Color-blind racism refers to “contemporary racial inequality as the outcome of nonracial dynamics.”[16]
The types of practices that take place under color blind racism are “subtle, institutional, and apparently nonracial.”[16] Those practices are not racially overt in nature such as racism under slavery, segregation, and Jim Crow laws. Instead, color-blind racism flourishes on the idea that race is no longer an issue in the country and that there are non-racial explanations for the state of inequality. Eduardo Bonilla-Silva writes that there are four frames of color-blind racism that support that view:[16]
- Abstract liberalism uses ideas associated with political liberalism. This frame is based in liberal ideas such as equal opportunity, individualism, and choice. It uses these ideas as a basis to explain inequality.[16]
- Naturalization explains racial inequality as a cause of natural occurrences. It claims that segregation is not the result of racial dynamics. Instead, it is the result of the naturally occurring phenomena of individuals choosing likeness as their preference.[16]
- Cultural racism explains racial inequality through culture. Under this frame, racial inequalities are described as the result of stereotypical behavior of minorities. Stereotypical behavior includes qualities such as laziness and teenage pregnancy.[16]
- Minimization of racism attempts to minimize the factor of race as a major influence in affecting the life chances of minorities. It writes off instances and situations that could be perceived as discrimination to be hypersensitivity to the topic of race.[16]
Natural disasters
When a disaster strikes—be it a hurricane, tornado, or fire—some people are inherently more prepared than others. “While all members of populations are affected by disasters, research findings show that racial and ethnic minorities are less likely to evacuate and more affected by disasters” than their Caucasian counterparts.[127] “During Hurricane Katrina, the large number of people seeking safety in designated shelters were disproportionately Black. In addition, the mortality rate for Blacks was 1.7 to 4 times higher than that of whites for all people ≥ 18.”[127] After Hurricane Katrina, many African Americans felt abandoned by the United States Government. 66% of African Americans “said that ‘the government’s response to [Katrina] would have been faster if most of the victims had been white.'”[128] For a disproportionate share of the impoverished in New Orleans, many had, and continue to have, a difficult time preparing for storms. Factors such as, “cultural ignorance, ethnic insensitivity, racial isolation and racial bias in housing, information dissemination, and relief assistance” all greatly contribute to the disparities in disaster preparedness.[127][129]
Credit scores
Credit score systems are well known to contain racial bias and have been shown to increase racial disparities[130][131][132][133] as studies show that African American and American Latino populations have substantially lower scores than the white American population on average.[134] Racial discrimination also results in impacts on the credit scores and economic security of communities of color—that ultimately, “entrenches and reinforces inequality by dictating a consumer’s access to future opportunities”.[134]
Numerous studies have found racial disparities in credit scoring:
- 1996 study found African Americans were three times as likely to have FICO scores below 620 as whites and that Hispanics were twice as likely.[135]
- 1997 study found Black, Indigenous, and people of color [BIPOC] neighborhood consumers had lower credit scores.[136]
- 2004 study found high Black, Indigenous, and people of color [BIPOC] zip codes to have significantly worse scores than non-Black, Indigenous, and people of color [BIPOC] zip codes.[137]
- 2004 study found that African American and Hispanic consumers constituted over 60% of the consumers having the worst credit scores.[138]
- 2004 study found the median credit score for whites in 2001 was 738, but the median credit score for African Americans was 676 and for Hispanics was 670.[139]
- 2004 research study found fewer than 40% of consumers who lived in high-Black Indigenous and people of color [BIPOC] neighborhoods had credit scores of over 701.[140]
- 2006 studied US counties with high Black, Indigenous, and people of color [BIPOC] populations determining that those counties had lower average credit scores than predominantly white counties.[141]
- 2007 study by the Federal Trade Commission found that African Americans and Hispanics strongly overrepresented in the lowest scoring categories regarding auto insurance company’s use of credit scores.[142]
- 2007 report found significant racial disparities in 300,000 credit files matched with Social Security records with African American scores being half that of white, non-Hispanics.[143]
- 2010 study found that African American in Illinois zip codes had scores of less than 620 at a rate of 54.2%. In zip codes that were majority Latino, 31.4% of individuals had a credit score of less than 620, and only 47.3% had credit scores greater than 700.[144]
- 2012 study examined the credit scores for about 200,000 consumers finding the median FICO score in majority minority zip codes was in the 34th percentile, while it was in the 52nd percentile for low minority zip codes.[145]
The outcomes for Black Americans because of this bias are higher interest rates on home loans and auto loans; longer loan terms; increased debt collection default lawsuits, and an increase in the use of predatory lenders.[146] FICO has defended the system stating that income, property, education, and employment are not evenly distributed across society and it is irrational to think an objective measure would not exhibit these discrepancies.[147] Tamara Nopper, sociologist at The Center for Critical Race & Digital Studies has stated that to solve the true issue of racism is not just to regulate it, as politics focus on, but to eliminate it in favor of public-owned banks that serve the community instead of shareholders.[131][148]
A related concept of insurance scoring has also been shown to discriminate along racial lines, disproportionately harming black and Latino populations.[149]
See also
- Civil rights movement
- Chinese Exclusion Act
- Glass ceiling
- Gender inequality in the United States
- Immigration Act of 1924
- Indian Appropriations Act
- Inequality in Hollywood
- Japanese American internment
- Mexican Repatriation
- Native Americans and reservation inequality
- The New Jim Crow
- Operation Wetback
- Racial achievement gap in the United States
- Racial segregation in the United States
- Racial wage gap in the United States
- Racism in the United States
- Redlining
- Reparations for slavery in the United States
- Sociology of race and ethnic relations
- The Whiteness of Wealth
- Tulsa race massacre
from Wikipedia contributors. (2025e, September 5). Racial inequality in the United States. Wikipedia.
~ ~
Racial Inequality in the United States – Department of Treasury, United States Government
By: Counselor for Racial Equity Janis Bowdler and Assistant Secretary for Economic Policy Benjamin Harris
Racial inequality is the unequal distribution of resources, power, and economic opportunity across race in a society. While the discussion of racial inequality in the United States is often focused on economic inequality, racial inequality also manifests itself in a multitude of ways that alone and together impact the well-being of all Americans. This includes racial disparities in wealth, education, employment, housing, mobility, health, rates of incarceration, and more.1
In her January 2022 remarks at the 2022 ‘Virtual Davos Agenda’ hosted by the World Economic Forum, Secretary of the Treasury Janet Yellen stated, “A country’s long-term growth potential depends on the size of its labor force, the productivity of its workers, the renewability of its resources, and the stability of its political systems.” This concept underpins the Biden Administration’s economic growth strategy, which Secretary Yellen has coined “modern supply side economics.” According to Secretary Yellen, modern supply side economics “prioritizes labor supply, human capital, R&D, and investments in a sustainable environment. These focus areas are all aimed at increasing economic growth and addressing longer-term structural problems, particularly inequality.”2 This reflects a recognition that despite an aim to advance economic growth, many policies in areas such as access to the labor market, housing, and infrastructure have not benefited all Americans. This has impacted the ability of communities of color, rural communities, and other historically marginalized people to fully participate in and benefit from the nation’s prosperity. Our economy as a whole cannot be as productive as possible unless all individuals are given the opportunity to be as productive as possible. As a result, the legacies of structural racism continue to hamper economic growth for everyone. Furthermore, some economic policies that would directly benefit Americans of all races and ethnicities have been undermined by zero-sum arguments that play to fears that one group will benefit at the expense of another.
There are, of course, moral, legal, microeconomic, and other reasons to promote a more just and equitable society. In a series of blog posts over the coming months, we will focus on the economic argument for reducing racial inequality. The economic cost of racial inequality is borne not just by the individuals directly faced with limited opportunities, but also has spillovers to the entire U.S. economy. Especially as the country becomes more racially diverse (see Figure 1), inequality poses an ongoing threat to our individual and collective economic welfare.
Figure 1: Changing Racial and Ethnic Composition of the U.S. Population
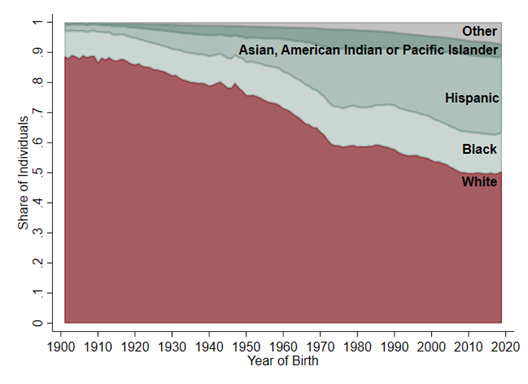
Notes: Hispanic refers to anyone of Hispanic ethnicity, regardless of race. The remaining groups exclude anyone of Hispanic ethnicity. Prior to the 1980 decennial census, individuals were not directly asked about whether they were of Hispanic origins. For data before the 1980 decennial census, Hispanic is imputed by IPUMS.
Source: Treasury calculations using U.S. Census Bureau data from IPUMS. Steven Ruggles, Sarah Flood, Sophia Foster, Ronald Goeken, Jose Pacas, Megan Schouweiler and Matthew Sobek. IPUMS USA: Version 11.0 [dataset]. Minneapolis, MN: IPUMS, 2021. https://doi.org/10.18128/D010.V11.0
Deputy Secretary of the Treasury Wally Adeyemo emphasized this argument in his September 2021 blog post: “The exclusion of communities of color from the ladder of economic opportunity holds back economic growth for the entire country. Pursuing racial equity is a vital opportunity to drive innovation and boost growth across the U.S. economy.”3 When people gain access to the resources they need to build their economic future and withstand financial shocks, it is not just good for individuals and their families, but it also benefits the communities where they live, work, and invest, with beneficial spillovers to the economy as a whole. Likewise, when investments are made that allow millions of people who have been held back economically to reach their full economic potential, it gives the United States an important advantage in an increasingly competitive global economy. We cannot afford to leave talent and opportunity on the table.
Below we briefly discuss the origins and persistence of inequality in the United States, highlight some of the key economic indicators of its impact, and give an overview of the issues we will explore in more depth in future posts.
Origins and Persistence of Racial Inequality in the United States
Racial inequality in the United States today is rooted in longstanding behaviors, beliefs, and public and private policies that resulted in the appropriation of the physical, financial, labor, and other resources of non-white people. While a review of the origins of racial inequity is beyond the scope of this blog, it is important to note the prominent role of inequitable and harmful policies—dating back to before the country’s founding. These include attacks on Native Americans’ political status and expropriation of their land, the reliance on slavery to underpin a significant portion of the colonial and then U.S. economy, and the Jim Crow laws and other formal and informal policies that enforced segregation and severely limited opportunities for non-white Americans. The millions of African Americans who left the southern United States to escape Jim Crow laws faced formal and informal employment, housing, and educational discrimination in destination cities in the North and West.4 Native Americans who survived the military conquests of the mid-19th century were subject to policies that disenfranchised them, forced their assimilation and relocation, and removed Native children from their households. Anti-Latino sentiment, which grew in the 19th century as emigration from Mexico to the United States increased in the years following the Mexican-American War, grew further following the Great Depression due to concerns that Mexican Americans were taking jobs from European-Americans.5 Similarly, anti-Asian sentiment grew following the arrival of Chinese immigrants during the California Gold Rush, which was manifested in the Chinese Exclusion Act prohibiting the immigration of Chinese laborers beginning in 1882, and was ignited again after the bombing of Pearl Harbor, with the establishment of Japanese internment camps by executive order, which resulted in the forced relocation and internment of about 120,000 Japanese Americans.6
While the most targeted racist laws and policies have been repealed or otherwise abandoned, subsequent policies, uneven enforcement of equal protections, and a failure to invest in individuals harmed by de jure and de facto discrimination has resulted in vastly limited opportunities and stark inequities between white and non-white Americans that have continued to this day. For example, maps drawn by the Home Owners Loan Corporation, a now defunct federal agency, to portray the relative riskiness of lending across neighborhoods in the 1930s were used by banks to deny access to credit to residents of the lowest-rated neighborhoods, who were often racial and ethnic minorities, though these policies also hurt poor white individuals.7 Moreover, this conduct depressed home ownership rates, house values, and rents and increased racial segregation in low-rated neighborhoods in subsequent decades, highlighting the lasting, negative economic consequences of racism on the community and on future residents of these neighborhoods, regardless of race.8 These and other policies and actions not only led to continued racial disparities in access to resources and opportunities, they also led to differences in the extent to which people of different races benefit from the resources and opportunities they already possess.9
These disparities are evident in the persistent over-representation of Black and Hispanic Americans among the population in poverty in the United States and in the widening of the racial wealth gap in recent decades.10 While the poverty rates for all racial and ethnic groups had been declining prior to the COVID-19 pandemic (see Figure 2), the gaps between the rates for Black and Hispanic Americans and non-Hispanic white Americans has remained relatively constant since the early 2000s. At the same time, the gap in average net wealth between Black and Hispanic households and non-Hispanic white households has widened significantly (see Figure 3).
Figure 2. Poverty Rate by Race and Hispanic Origin: 1959 to 2019
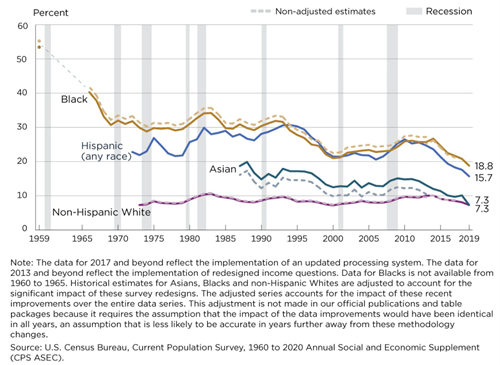
Figure 3. Household Net Worth by Race and Hispanic Origin: 1989 to 2019
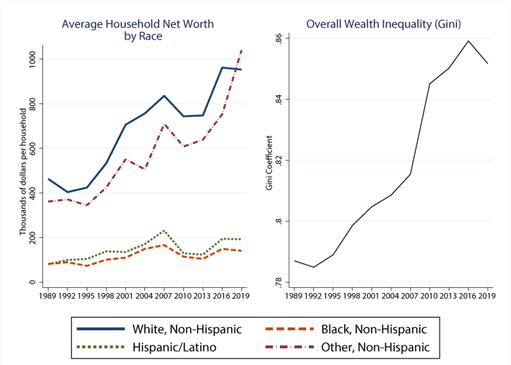
Source: Federal Reserve Board, https://www.federalreserve.gov/econres/notes/feds-notes/wealth-inequality-and-the-racial-wealth-gap-20211022.htm
Racial disparities in outcomes predictive of future success appear early in life. In 2010, math skills at kindergarten entry were over half a standard deviation higher for white students than for Black or Hispanic students, with similar disparities in reading skills.11 These disparities in educational outcomes continue into higher education. In 2019, 40 percent of white adults had earned a bachelor’s degree compared to just 26, 19, and 17 percent of Black, Hispanic, and American Indian or Alaska Native adults, respectively.12
Large educational disparities, coupled with racial discrimination in the labor market and other factors, lead to pronounced differences in economic security across racial groups. In 2019, the unemployment rate was 6.1 percent for both Black and American Indian or Alaska Native adults, compared to just 3.3 and 2.7 percent for white and Asian adults, respectively. Similarly, the rate for Hispanic adults was 4.3 percent and only 3.5 percent for non-Hispanics.13
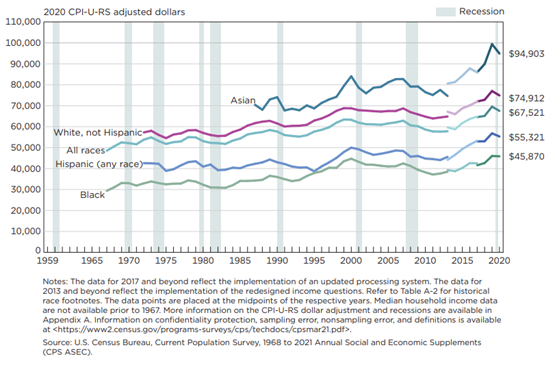
In addition, Black and Hispanic adults continue to have considerably lower earnings than White or Asian adults. Median household income in 2020 was roughly $46,000 and $55,500 for Black and Hispanic workers, respectively, compared to $75,000 and $95,000 for white and Asian households, as shown in Figure 4. These earnings differences have changed little since 1970 and are one of the primary contributors to the persistence of the racial wealth gap. In 2019, the median white family had $184,000 in family wealth compared to just $23,000 and $38,000 for the median Black and Hispanic families, respectively.14
Racial disparities in educational and economic outcomes not only impact the economic well-being of racial and ethnic minorities, they have also been shown to inhibit economic growth for the U.S. economy as a whole, which affects the economic security of every American, regardless of race. For example, recent research by economists Chang-Tai Hsieh, Erik Hurst, Charles I. Jones, and Peter J. Klenow shows that up to 40 percent of growth in U.S. GDP per capita between 1960 and 2010 can be attributed to increases in the shares of women and Black men working in highly skilled occupations, likely due to changes in social norms that previously hindered talented women and Black men from pursuing their comparative advantage.15 This research suggests that sexist and racist social norms prevented the U.S. economy from reaching its full potential and that working to ensure that every American has an equal opportunity to pursue the career he or she chooses should improve economic outcomes for all.
Figure 4. Real Median Household Income by Race and Hispanic Origin: 1967 to 2020
Racial gaps in well-being extend beyond educational attainment and economic security. Health disparities, for example, also begin early in life and persist over the lifespan. Black and Hispanic Americans face higher rates of child abuse,16 lead exposure,17 obesity in childhood,18 and chronic illness in adulthood than white Americans.19 These groups often experience restricted access to quality health care, an issue further illuminated by the recent global pandemic. Compared to white non-Hispanic Americans, Hispanic, Black non-Hispanic, and American Indian or Alaska Native non-Hispanic Americans are 1.8, 1.7, and 2.1 times more likely to die from COVID-19.20 Moreover, as the COVID-19 pandemic has shown, the inequitable distribution of healthcare in the United States can negatively impact the health of all Americans, including those with access to high-quality services.
In addition, people of color in the United States are over-represented in neighborhoods with high poverty rates. In 2019, nearly a quarter of American Indians or Alaska Natives, 21 percent of non-Hispanic Black people, and 17 percent of Hispanic people lived in high-poverty neighborhoods, defined as Census tracts with a poverty rate of 30 percent or higher. In contrast, only 4 percent and 6 percent of white and Asian or Pacific Islander people lived in high-poverty neighborhoods.21 High-poverty neighborhoods often lack vital resources and amenities like good schools, large and affordable grocery stores, reliable public transportation, and safe and clean community spaces that enable residents to succeed in the classroom and on the job.
It is important to note that while we have reliable measures and data sources to define the differences in many outcomes between racial and ethnic groups over the past forty years, our ability to trace racial inequality back further and examine the country’s progress since the end of slavery is limited by the quality and quantity of data available. For example, greater disparities exist within the Asian American and Pacific Islander group than are often evident in aggregate data, and data on Native communities in the United States is usually inadequate for any in depth analyses. Moreover, for some outcomes such as wealth, our ability to measure contemporary differences is also limited by data availability.
Roadmap for this Blog Series
Upcoming posts will discuss in greater depth the extent of racial inequality in economic security and explain how differences in in educational opportunity and attainment, neighborhoods and environmental factors, health and access to healthcare, and employment and job quality, contribute to and are caused by the persistence of racial disparities in economic well-being. Each post will highlight important facts, discuss how key outcomes have evolved over time, and emphasize the connections with other components of economic inequality, with the goal of calling attention to areas where more work is needed to advance racial equity. In addition, we will discuss issues related to data quality and coverage that affect our ability to truly understand the trajectory of racial inequality in the United States.
[1] Shapiro, Thomas M. The Hidden Cost of Being African American: How Wealth Perpetuates Inequality. Oxford: Oxford University Press, 2004.
[2] https://home.treasury.gov/news/press-releases/jy0565
[3] https://home.treasury.gov/system/files/136/American-Rescue-Plan-Centering-Equity-in-Policymaking.pdf
[4]Derenoncourt, Ellora. 2022. “Can You Move to Opportunity? Evidence from the Great Migration.” American Economic Review 11 (2): 369-408.
[5] https://www.history.com/news/the-brutal-history-of-anti-latino-discrimination-in-america
[6] https://www.britannica.com/event/Japanese-American-internment. For additional details on the economic impacts of inequitable government policy, see:
- Aaronson, Daniel, Daniel Hartley, and Bhashkar Mazumder. 2021. “The Effects of the 1930s HOLC ‘Redlining’ Maps.” American Economic Journal: Economic Policy 13 (4): 355-92.
- Carruthers, Celeste K., and Marianne H. Wanamaker. 2017. “Separate and Unequal in the Labor Market: Human Capital and the Jim Crow Wage Gap.” Journal of Labor Economics 35 (3): 655-696.
- Jones, Maggie E.C. 2021. “The Intergenerational Legacy of Indian Residential Schools.” Unpublished working paper. Available at: https://maggieecjones.files.wordpress.com/2021/02/intergenerationalrs.pdf
- Rothstein, Richard. The color of law: A forgotten history of how our government segregated America. Liveright Publishing, 2017.
[7] https://www.britannica.com/topic/redlining
[8] Aaronson, Daniel, Daniel Hartley, and Bhashkar Mazumder. 2021. “The Effects of the 1930s HOLC ‘Redlining’ Maps.” American Economic Journal: Economic Policy 13 (4): 355-92.
[9] Pfeffer, Fabian T., and Alexandra Killewald. 2018. “Generations of Advantage: Multigenerational Correlations in Family Wealth.” Social Forces 96 (4): 1411-42.
[10] Wealth is the total financial value of what an individual or household owns (assets) minus all debts (liabilities), representing the sum of financial resources available to an individual or household at a point in time. Assets include the value of a home, retirement savings, stocks, bonds, money in the bank, and other items of value, while liabilities include home mortgages, auto loans, credit card debt, and student debt. The racial wealth gap is the difference in wealth held by different racial and ethnic groups.
[11] Reardon, Sean F., and Ximena A. Portilla. 2016. “Recent Trends in Income, Racial, and Ethnic School Readiness Gaps at Kindergarten Entry.” AERA Open 2(3): 1-18. https://doi.org/10.1177/2332858416657343.
[12] https://nces.ed.gov/programs/digest/d20/tables/dt20_104.10.asp
[13] https://www.bls.gov/opub/reports/race-and-ethnicity/2019/home.htm
[14] https://www.stlouisfed.org/open-vault/2020/december/has-wealth-inequality-changed-over-time-key-statistics
[15] Hsieh, Chang-Tai, Erik Hurst, Charles I. Jones, and Peter J. Klenow. 2019. “The Allocation of Talent and U.S. Growth.” Econometrica, 87 (5): 1439-1474.
[16] Dakil, Suzanne R., Matthew Cox, Hua Lin, and Glenn Flores. “Racial and Ethnic Disparities in Physical Abuse Reporting and Child Protective Services Interventions in the United States.” Journal of the National Medical Association 103(9-10): 926-931.
[17] Teye, Simisola O., Jeff D. Yanosky, Yendelea Cuffee, Xingran Weng, Raffy Luquis, Elana Farace, and Li Wang. 2021. “Exploring Persistent Racial/Ethnic Disparities in Lead Exposure among American Children Aged 1-5 Years: Results from NHANES 1999-2016.” International Archives of Occupational and Environmental Health 94: 723-730.
[18] Anderson, Sarah E., and Robert C. Whitaker. 2009. “Prevalence of Obesity Among US Preschool Children in Different Racial and Ethnic Groups.” Arch Pediatr Adolesc Med. 163(4):344–348. doi:10.1001/archpediatrics.2009.18
[19] Quiñones, Ana R., Anda Botoseneanu, Sheila Markwardt, Corey L. Nagel, Jason T. Newsom, David A. Dorr, Heather G. Allore. 2019. “Racial/Ethnic Differences in Multimorbidity Development and Chronic Disease Accumulation for Middle-Aged Adults.” PLoS ONE 14(6): e0218462. https://doi.org/10.1371/journal.pone.0218462
[20] https://www.cdc.gov/coronavirus/2019-ncov/covid-data/investigations-discovery/hospitalization-death-by-race-ethnicity.html
[21] https://nationalequityatlas.org/indicators/Neighborhood_poverty#/?geo=01000000000000000
from — Racial inequality in the United States. (2025, February 8). U.S. Department of The Treasury.
September 30th, 2025
Hudson Valley, New York
This is one of the words/ phrases you can’t say in the new Trump Regime. See a comprehensive list at the Forbidden Words Project.
image: bird bath bird bath © Holly Troy 9.2025
Discover more from holly troy ~ sacred folly
Subscribe to get the latest posts sent to your email.
